

Should California Count and Report on Votes More Quickly?
Frustration bubbled up in California and around the country as we waited 8 days for election results in California to see which party would control the House. Was the wait necessary?

Today’s Topic of Debate
On Election Night 2022, as races were called and vote counts reached the high ninety percentile in many states around the country, California had counted just north of 40% of the expected ballots by midnight. The percent counted didn’t change much over the next few days. Several days later all but the closest races in other states had been called and the vast majority of votes counted.
Politico’s California Playbook on November 28, said, “Yes, it’s true we’re still waiting on final calls in several Assembly and Senate races” even though we’re now 3 weeks from election day. The fate of the control of the House hung in the balance for over a week until several of the not-so-close California races were finally called.
California’s laggard performance in this November’s election begs the question: Is California really significantly slower than the other states or was this just an outlier or the effect of being on the West Coast with a late poll closing time?
A review of election reporting data from the 2020 primary (Washington Post), 2020 general (New York Times), and 2022 primary (FiveThirtyEight) reveals 3 characteristics of California’s vote counting speed:
California is the slowest or among the slowest in reporting final results, taking 10 days in the 2020 primary while 50% of states shared final results in less than 24 hours
Yet, California’s initial reporting of results - within an hour of polls closing - is roughly average among West Coast states
However, California makes little progress over the next 24-48 hours while most other states plow through all or almost all of their ballots, leaving California way behind
I walk through the data in detail in this Instagram video.
California’s vote counting has also slowed considerably. In the November 2004 presidential election, 81% of ballots were counted within 2 days of the election. In this year’s primary, less than 50% were counted within 2 days.
This brings us to today’s question, which California State Senator Steve Glazer tees up nicely: “Is there a way to make it faster? Yes, there is. Is it worth the price, the cost?”
Argument in Brief:
Given the impact of California’s slow vote counting, today’s topic of debate is: Should California count and report on votes more quickly?
Voting rules that slow the vote count increase voter participation
Voting rules that slow the vote count increase the integrity and accuracy of election results
It is too expensive to count and report results significantly more quickly
We should speed up our vote counting and reporting since the policies California blames for slowing it down either don’t deliver the benefit they promise or they’re in place in other states that deliver results much more quickly.
Case For
Reduces voter faith in the system
According to a Newsweek poll conducted last month, 40% of Americans believe the 2020 Election was “rigged or stolen.” Whether you believe the election was stolen or not, this level of distrust in our elections is a major threat to future elections and a functioning democracy.
Why do so many Americans believe the election was stolen? The Brennan Center for Justice calls out slow vote counting as a key reason:
The slow pace of counting mail ballots in states such as Pennsylvania, Michigan, and Wisconsin was a key source of election disinformation in 2020. The delays provided President Trump and his allies with a pretext to claim that the election was being stolen from them as mail ballots, which overwhelmingly went for Biden, were counted and added to vote totals.
Slow vote counting feeds skepticism about our elections because it can result in changes in projected winners. This doesn’t mean that California (or any other state) must finish counting votes by midnight on Election Day. Virtually no state achieves this today. However, the lower the percentage of votes counted on Election Day, the more likely it is that the expected outcome could flip - and this is what, perhaps more than anything, raised suspicion on behalf of many Trump supporters in 2020, including this Georgia voter:
“When I went to bed, Trump was so in the lead, and then (I got) up and he’s not in the lead. I mean, that’s crazy.”
California saw an example of this closer to home in 2018 when the Associated Press called the 21st Congressional District for David Valadao on Election Night only to retract that projection 22 days later when Democrat TJ Cox pulled ahead.
The challenge with this effect of slow vote counts is that it doesn’t matter if there are logical reasons for changes in the projected winner. What matters is perception - and this perception, among other factors, is why just 63% of Americans are very or somewhat confident in the accuracy of US elections.
Michael Wines of The New York Times extends this effect beyond distrust in elections:
“What happens when Election Day lasts for weeks? The short, glib answer to that question is that Jan. 6 happens…”
Voter skepticism linked to slow vote counts predates both the 2020 election and January 6th. In a March 2017 report, California’s nonpartisan Legislative Analyst Office made the following assertion:
“…counties now take weeks to finish counting ballots. Some voters are saying this undermines their confidence in the election process, in part because California counts ballots so much slower than other states do.”
While we don’t have hard evidence, anecdotes suggest that if we could count more votes on Election Night and in the following few days, we could restore some confidence in our elections.
Slows the transition to new government and leadership
While it may seem trivial to argue for speeding up vote counting to give elected officials more time to transition into office, the 2-month gap from Election Day until a new Congress, for example, convenes is critical - especially for newly elected officials.
The 118th Congress will convene on January 3 of next year, exactly 8 weeks after the election. In California, final results don’t need to be tabulated until December 8 and reported until December 9. In close races, this leaves elected officials just 3.5 weeks to prepare.
For California state senators and assembly members, the preparation time is even less - particularly this year since Governor Newsom is expected to convene a special session on December 6, several days before final results are required. As Politico describes,
“...we’re one week away from the Dec. 5 organizing session, where legislators will gather in Sacramento for the first time to be sworn-in and cast leadership votes. They’re also expected to gavel in for a special session that day, per Gov. Gavin Newsom’s request, though details on that session and the gas windfall tax that is supposed to go along with it remain scant.”
And yet we’re still waiting on final calls in a few races.
Delayed results also have implications for chamber leadership too. In 2020, the Georgia runoff process kept the country from knowing which party would control the Senate for an additional 2 months.
Case Against
Voting rules that slow the vote count increase voter participation
There are 4 primary voting regulations that could increase voter participation and in turn, slow the vote count:
Universal mail-in ballots (AB 860 - signed in June 2020 - required the state to send a vote-by-mail (VBM) ballot to all registered voters due to COVID. AB 37 - signed in September 2021 - made this permanent.)
Mail-in ballots can arrive up to 7 days after Election Day (also became law through AB 37)
Voters whose ballots are rejected can submit a corrected ballot up to two days prior to certification of the election (the election is certified on the 30th day after the election) (part of Election Code amended in 2007)
Voters register and vote on Election Day or may vote in the wrong precinct using a provisional ballot (same-day registration was enacted in 2012)
We need to answer 2 questions about these rules:
Do they increase voter participation?
Do they slow down vote counting significantly?
If the answer to both questions is “yes,” then we can make the case that California has uniquely accessible election rules that increase participation at the cost of speed of reporting.
First, let’s see if these bills increase voter participation, an argument California Secretary of State Shirley Weber made at the signing of AB 37:
“The bill will permanently expand access and increase participation in our elections by making voting more convenient and meeting people where they are. Vote-by-mail has significantly increased participation of eligible voters. Voters like having options for returning their ballot whether by mail, at a secure drop box, a voting center or at a traditional polling station. And the more people who participate in elections, the stronger our democracy and the more we have assurance that elections reflect the will of the people of California.”
If California has uniquely accessible election rules, we would expect voter participation in the state to be high compared to other states. In both the 2016 and 2018 elections, California came in below average in voter turnout, ranking 42nd (59.7% turnout) and 32nd (54.9% turnout) respectively according to the U.S. Election Assistance Commission reports1.
However, in 2020, after all the noted changes were enacted, California jumped to 16th, achieving a turnout rate of 81%. This increase of nearly 22 percentage points from the last presidential election was the third-highest increase and more than double the national average.
Was this jump driven by California’s new policies?
We can’t know conclusively, but the percentage of people voting by mail jumped from 52% in 2016 to 82% in 2020, suggesting that universal vote-by-mail (VBM) played some role.
Did we see this same pattern across the nation?
Not necessarily. There is no correlation between increases in VBM and increases in turnout when looking at data from all 50 states, as shown in the chart below. Of the states that saw above-average increases in VBM, almost twice as many (17) saw below-average increases in turnout than above-average increases in turnout.
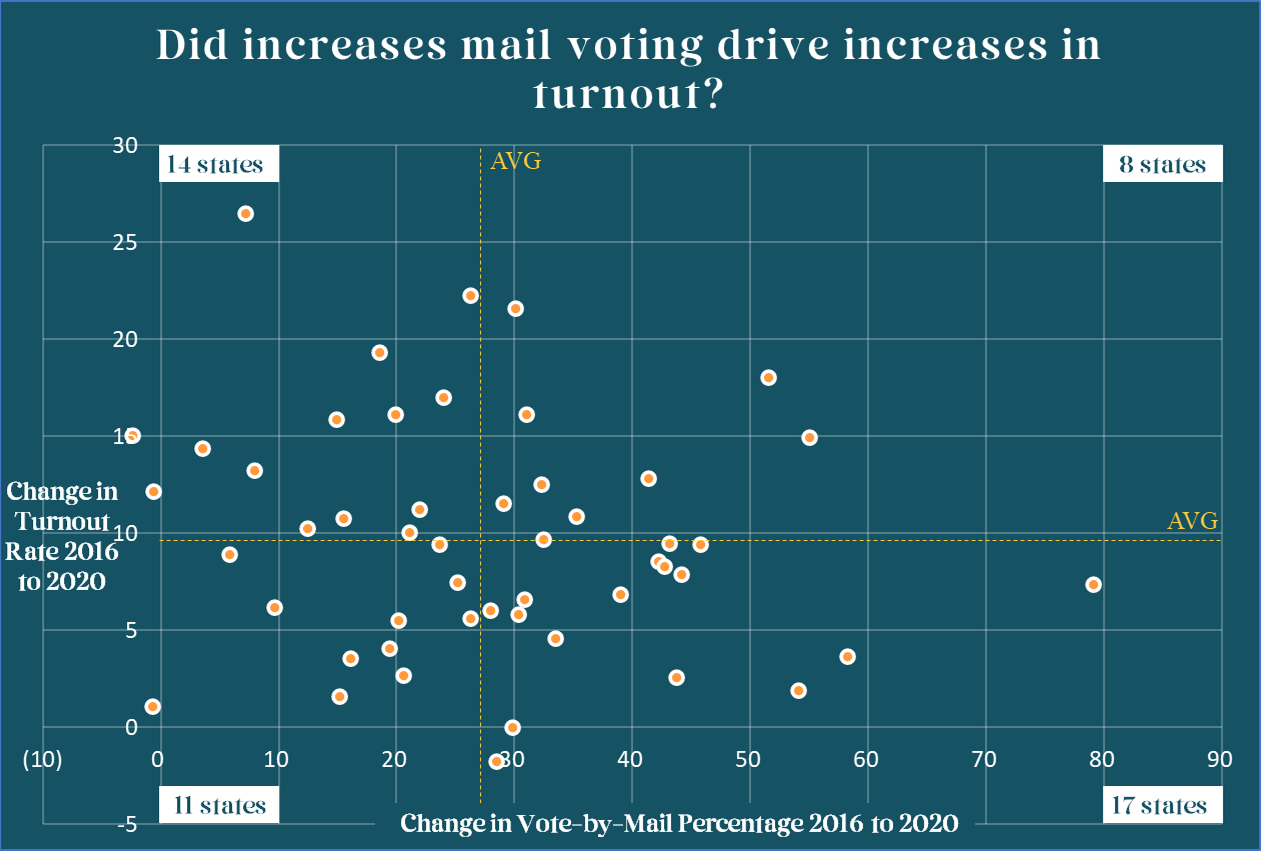
This isn’t to say that there is no relationship between VBM and turnout. There is a small positive correlation between VBM percentages and turnout rates in 2020.
What can we conclude?
For California, the changes in election policies leading up to the 2020 election seem to have spurred a significant increase in participation. However, it’s important to consider that a different factor could have caused the increase in turnout. While there is still time to count more votes, the turnout in California’s 2022 election is just 50% as of November 29, which is less than the turnout in 2018.
With moderately strong support for the idea that the noted election rules drove increases in voter participation, we turn to the question of whether they significantly slow down results reporting.
There are 3 key policy decisions that impact the speed with which vote-by-mail ballots are counted:
How election officials must verify the identity of the voters
When election officials can begin processing and counting VBM ballots
What election officials are required to do if there is a problem with a VBM ballot
Verification: California and 26 other states conduct signature verification on mail ballots, in which they compare the signature on the envelope to the signature on file for the voter. Most of the other states require even more stringent verification processes, while 9 states only verify that the ballot has been signed but not that the signature matches the voter’s signature on file.
Timing: Here is when states can begin counting VBM ballots:
10 states allow both processing and counting to begin before Election Day
23 states, including California, allow counting to begin on Election Day but before polls close
16 states and Washington, D.C. do not allow counting until polls close
Curing Ballots: California and 23 other states require election officials to notify voters when there is a missing signature or a signature discrepancy—and require that voters must be given an opportunity to correct it.
In summary, California’s policies will, for the most part, yield the slowest counting process, but they share these policies with large portions of other states. As a result, we can’t conclude that California’s vote-by-mail policies are driving the slow counting because other states with the same policies are reporting results much more quickly.
However, California could argue that these policies differentially slow its vote count down if it has to process a far larger share of VBM ballots than other states. Secretary of State Shirley Weber alluded to this argument the week after this year’s general election:
“We have a huge population of registered voters and California stresses enfranchisement, so we have a process that by law ensures both voting rights and the integrity of elections.”
In the 2020 general election, California had a higher VBM percentage than all but 7 states. However, all but 1 of those 7 states had counted a higher percentage of votes by 9am PST the next day than California. On average, the 7 other states had reported 83% of the vote vs. California’s 68%. The one state that was slower than California (New Jersey) went from 7% VBM in 2016 to 86% in 2020, likely requiring them to overhaul their election processing system.
California’s provisional ballot rules - which aim to increase voter participation - can also significantly slow down vote counting. When a provisional ballot is cast, it is stored separately from other ballots and investigated by local election officials. In 2016 and 2018, California received roughly 9 times higher percentages of provisional ballots than the national averages with 8.9% and 7.8% of ballots cast being provisional, respectively.
These unusually high provisional ballot numbers could slow down California’s results reporting, but something interesting happened in 2020 that likely lets provisional ballots off the hook. California’s provisional ballot percentage dropped from 7.8% in 2018 to just 1.2% in 2020 - and yet, as I have covered, our vote counting didn’t speed up.
California did implement policies in 2020 that both seem to have increased voter participation and would likely slow down vote counting, but we can’t blame these policies because we underperform states that have the same policies and that are processing the same portion of mail ballots.
Voting rules that slow vote counting increase the integrity and accuracy of election results
Alex Padilla, current US Senator from California and former California Secretary of State said that when he explains to those frustrated with the slow pace of California’s election reporting the process we go through, “most people do settle with, it’s smarter to get it right.” Padilla’s implicit argument is that going slow allows California to get its election results right.
Kim Alexander, president of the California Voter Foundation, makes the same argument:
“The ironic thing is that the people who are making claims questioning the veracity of our election results because of the long vote counts are overlooking that the reason it takes a long time to count mail ballots is because we are ensuring the security of the vote.”
Padilla’s and Alexander’s statements inversely suggest that going faster - as essentially every other state does - leads to less accurate results. But does California get more accurate results than other states?
This, as you can imagine, is very difficult to determine because there is no master answer sheet to compare any state’s results to. The one scenario in which we do have a comparison to the initial vote count is vote recounts.
The last recount in a statewide election in California was the 2014 state controller primary. The recount stopped before it was completed when the trailing candidate conceded. During the 6 days the recount was underway in one county (the recount was only going to take place in select counties and only a few had started), 3 of the 3,520 votes were changed resulting in a 99.925% accuracy rate. For comparison, Georgia conducted 2 recounts of the 2020 presidential election and changed ~1,700 of the more than 5 million votes for an accuracy rate of 99.964%.
While the limited recount data we have doesn’t support the idea that California is any more accurate than other states, let’s assume, for the sake of argument, that it is. What exactly is California doing that would enable us to get more accurate results than other states?
The 3 voting regulations that one could argue increase the count accuracy and also slow the vote count are:
Poll workers verify the signature on mail-in ballots, matching the signature to a signature on file
Voters whose ballots are rejected can submit a corrected ballot up to two days prior to certification of the election
California waits until Election Day to start processing mail ballots
The problem with pointing to these regulations as the reason for California’s slow vote count is that most other states do the exact same thing - as established above.
But maybe California rejects more ballots, which leads to a larger share of ballots requiring curing (i.e., fixing). This is not true. In the 2020 election, California rejected 0.6% of ballots while the national rejection rate was 0.8%.
Further, unlike the 28 states that have laws prompting automatic recounts, California does not. California also requires the recount requesters to pay for the recount, while a number of other states will pay for the recount if the margin is small enough, further dissuading recounts.
It would be too expensive to count and report results more quickly
Cathy Darling Allen, Shasta County’s Registrar of Voters told CalMatters:
“Someone I worked with once told me, ‘Elections can be cheap and fast, and they can be accurate — but you have to pick two.’”
This begs the question: Does California spend less on its elections (per voter) than other states?
This is a difficult question to answer because who pays for what share of election administration costs varies from state to state and from election to election (based on the type of election). In many states, including California, counties cover a share of the costs. The California Association of Clerks and Election Officials (CACEO) did try to get accurate cost data through a privately funded project several years ago.
CACEO concluded in its 2019 report that the statewide average cost per voter of California elections was $8.31. Notably, this was before universal vote-by-mail ballots were being sent, which has driven up costs in California and the 7 other states that have such a policy.
The MIT Election Data and Science Lab collected election cost data from 26 states in 2017, finding an average of $8.10 per voter. While we don’t have much data to draw from, here again, the data we do have suggests that California’s elections are, if anything, marginally more expensive than other states’ elections.
Unfortunately, it appears that California’s elections are neither cheap nor fast - and arguably, no more accurate than other states’ elections where elections are fast.
My Assessment
Let’s return to where we began - Steve Glazer’s comments:
Is there a way to make it faster? Yes, there is. Is it worth the price, the cost?”
What would California be sacrificing to speed up its election reporting?
The short answer appears to be almost nothing. Based on the arguments above2, the price of speeding up elections could be negligible because the very policies that aim to increase access and reduce costs are already in place in many other states which count votes much more quickly while scoring higher turnout rates. The cause of California’s slow vote counting is neither the policies aimed at increasing turnout and accuracy nor the percentage of voters engaging in voting methods that take longer to process.
The reasons to speed up the vote count are less concrete and quantifiable than the reasons to maintain the status quo, but they don’t have to be as strong. If we can get results faster without sacrificing participation or accuracy, we should. Other states are doing better than us on participation and accuracy and getting results much more quickly at a lower financial cost.
Should California speed up its vote counting and reporting? Yes, we should.
But how? If our policies and proportions are similar to other states, then what is slowing us down? The Legislative Analyst’s Office’s recommendation to the state legislator in 2017 carries an important implication. Here’s what they recommend:
“Should the Legislature determine that swift determination of elections results is an important state goal, the Legislature could make receipt of funding conditional on counties demonstrating efforts to improve the swiftness of their tallies.”
This suggests that counties could count votes faster, but they have no incentive to right now. In the words of New York Times contributor Michael Wine, “In California, at least, a leisurely tally is effectively state policy.”
The official counting of votes did not need to start until November 10 - 2 days after the election (which explains why California makes almost no progress during the 48 hours after the election). Once the counting starts, county offices are required to continue the vote count every day for just 6 hours a day, excluding weekends and holidays. 6 hours a day? Counties have 30 days to finish counting. Why rush?
This isn’t to say that our election officers are lazy. Our state policies have created an environment where Parkinson’s Law - work will expand to fill the time allotted for its completion - may just be causing California to count votes and report results much slower than other states without reason. It’s time we do something about this.
There are, surprisingly, a number of different conflicting data sources for voter turnout rates. I chose to go with the federal government’s numbers so that comparisons across states could be made.
The one piece of data I couldn’t find is how many VBM ballots arrive after Election Day but before the 7-day deadline. If California happened to have a very high proportion of ballots fitting this characteristic, that could explain the slow vote counting.